Only the file name is needed since graphviz's `render()` automatically
adds the file extension.
Also, unnecessary .gv (.dot) files are output, so the `cleanup=True`
option has been modified to prevent them from being saved.

Here is a similar modification, but in a different content.
- https://github.com/openai/openai-agents-python/pull/451
2.9 KiB
2.9 KiB
| search | ||
|---|---|---|
|
エージェントの可視化
エージェントの可視化を使用すると、 ** Graphviz ** を用いてエージェントとその関係を構造化されたグラフィカル表現として生成できます。これは、アプリケーション内でエージェント、ツール、handoffs がどのように相互作用するかを理解するのに役立ちます。
インストール
オプションの viz 依存関係グループをインストールします:
pip install "openai-agents[viz]"
グラフの生成
draw_graph 関数を使用してエージェントの可視化を生成できます。この関数は有向グラフを作成し、以下のように表現します。
- エージェント は黄色のボックスで表されます。
- ツール は緑色の楕円で表されます。
- handoffs はエージェント間の有向エッジで示されます。
使用例
from agents import Agent, function_tool
from agents.extensions.visualization import draw_graph

@function_tool
def get_weather(city: str) -> str:
    return f"The weather in {city} is sunny."

spanish_agent = Agent(
    name="Spanish agent",
    instructions="You only speak Spanish.",
)

english_agent = Agent(
    name="English agent",
    instructions="You only speak English",
)

triage_agent = Agent(
    name="Triage agent",
    instructions="Handoff to the appropriate agent based on the language of the request.",
    handoffs=[spanish_agent, english_agent],
    tools=[get_weather],
)

draw_graph(triage_agent)
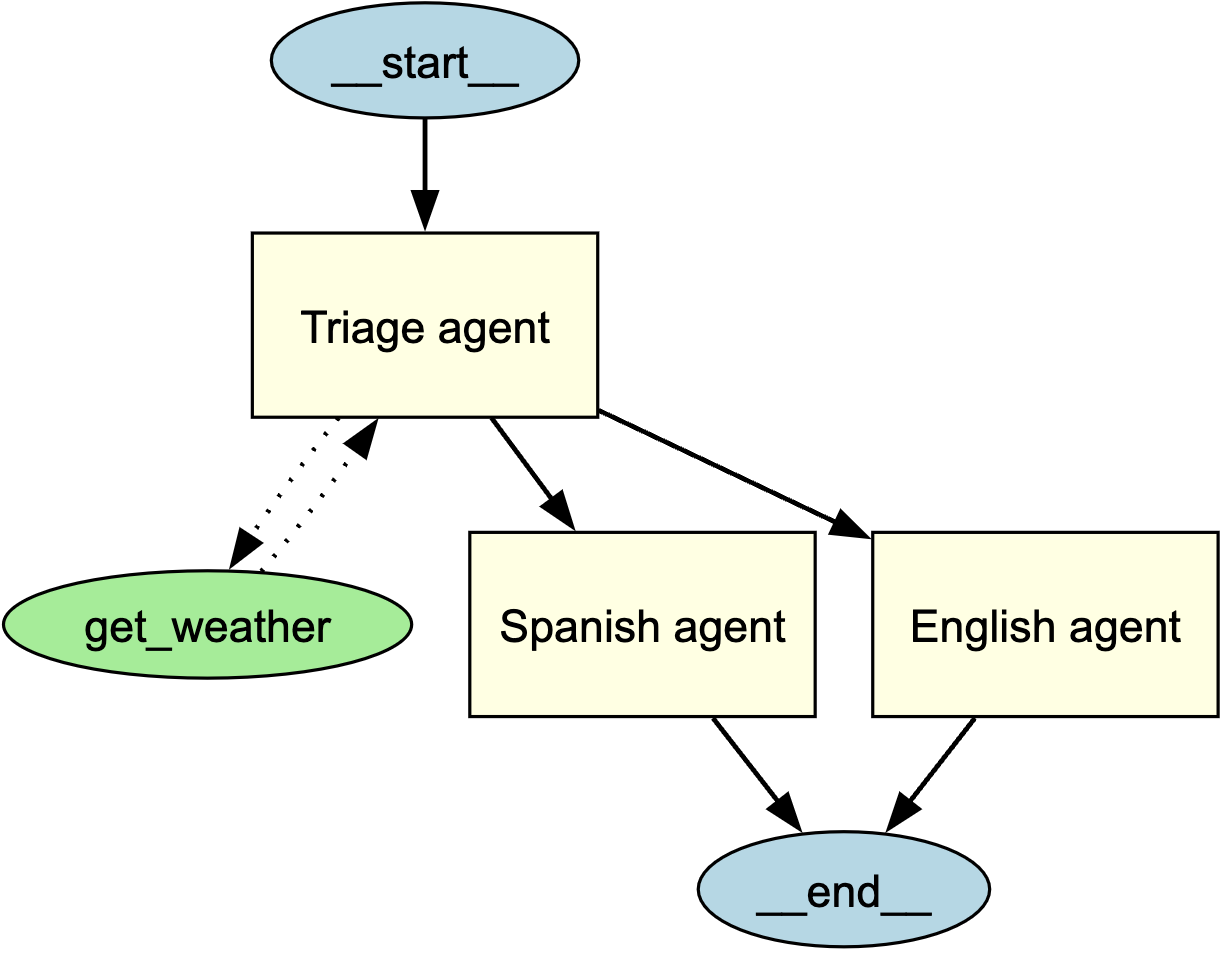
これにより、 triage agent の構造と、それがサブエージェントやツールとどのようにつながっているかを視覚的に表すグラフが生成されます。
可視化の理解
生成されたグラフには次の要素が含まれます。
- エントリーポイントを示す start node (
__start__) - 黄色の塗りつぶしを持つ 矩形 のエージェント
- 緑色の塗りつぶしを持つ 楕円 のツール
- 相互作用を示す有向エッジ
- エージェント間の handoffs には 実線の矢印
- ツール呼び出しには 破線の矢印
- 実行が終了する位置を示す end node (
__end__)
グラフのカスタマイズ
グラフの表示
デフォルトでは、draw_graph はグラフをインラインで表示します。別ウィンドウでグラフを表示するには、次のように記述します。
draw_graph(triage_agent).view()
グラフの保存
デフォルトでは、draw_graph はグラフをインラインで表示します。ファイルとして保存するには、ファイル名を指定します:
draw_graph(triage_agent, filename="agent_graph")
これにより、作業ディレクトリに agent_graph.png が生成されます。