3.3 KiB
Agent Visualization
Agent visualization allows you to generate a structured graphical representation of agents and their relationships using Graphviz. This is useful for understanding how agents, tools, and handoffs interact within an application.
Installation
The visualization functionality relies on the Graphviz package. To use it, ensure you have Graphviz installed and add it as a dependency in pyproject.toml. Alternatively, install it directly via pip:
pip install graphviz
Generating a Graph
You can generate an agent visualization using the draw_graph function. This function creates a directed graph where:
- Agents are represented as yellow boxes.
- Tools are represented as green ellipses.
- Handoffs are directed edges from one agent to another.
Example Usage
from agents import Agent, function_tool
from agents.visualizations import draw_graph

@function_tool
def get_weather(city: str) -> str:
    return f"The weather in {city} is sunny."

spanish_agent = Agent(
    name="Spanish agent",
    instructions="You only speak Spanish.",
)

english_agent = Agent(
    name="English agent",
    instructions="You only speak English",
)

triage_agent = Agent(
    name="Triage agent",
    instructions="Handoff to the appropriate agent based on the language of the request.",
    handoffs=[spanish_agent, english_agent],
    tools=[get_weather],
)

draw_graph(triage_agent)
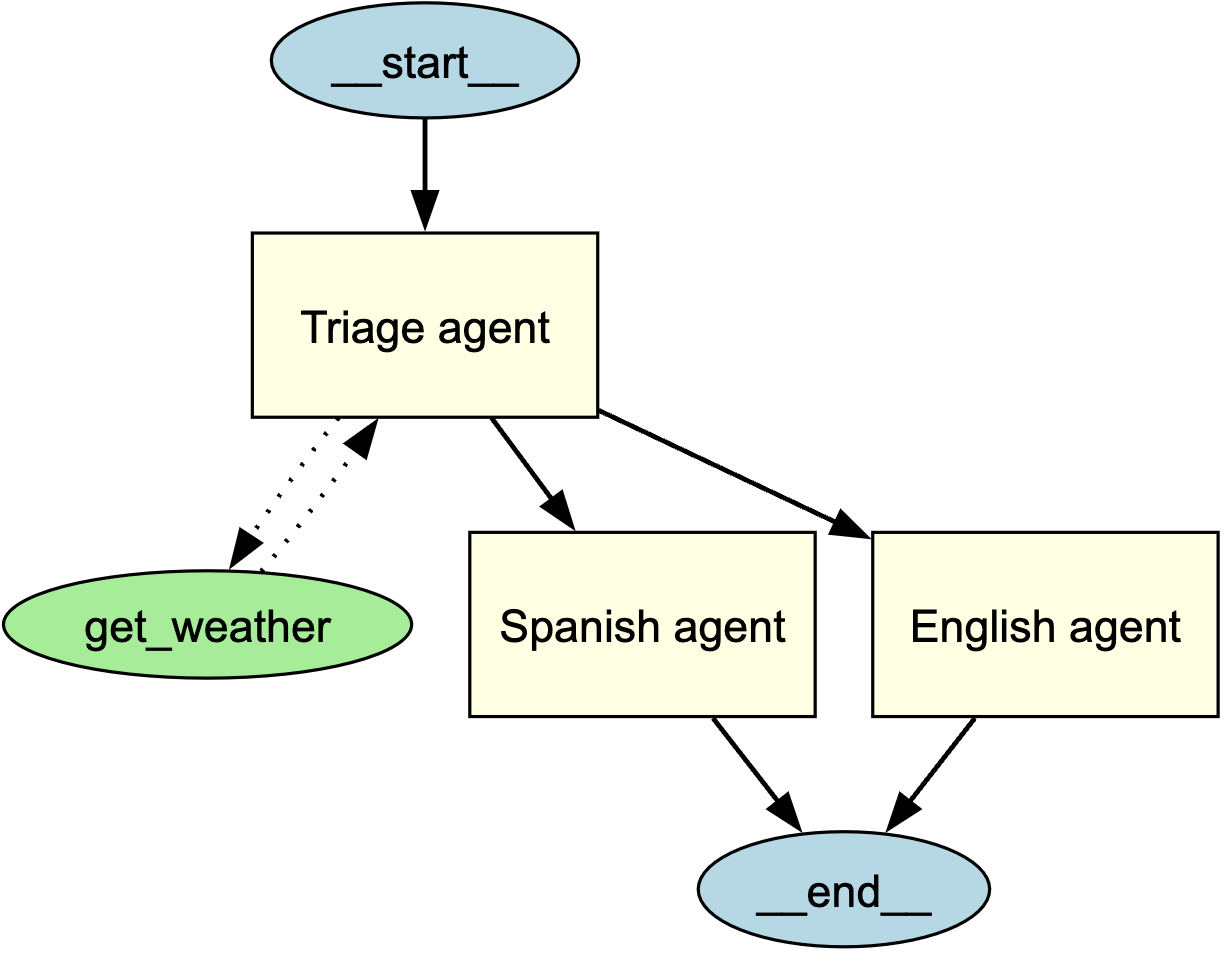
This generates a graph that visually represents the structure of the triage agent and its connections to sub-agents and tools.
Understanding the Visualization
The generated graph includes:
- A start node (
__start__) indicating the entry point. - Agents represented as rectangles with yellow fill.
- Tools represented as ellipses with green fill.
- Directed edges indicating interactions:
- Solid arrows for agent-to-agent handoffs.
- Dotted arrows for tool invocations.
- An end node (
__end__) indicating where execution terminates.
Customizing the Graph
Showing the Graph
By default, draw_graph displays the graph inline. To show the graph in a separate window, write the following:
draw_graph(triage_agent).view()
Saving the Graph
By default, draw_graph displays the graph inline. To save it as a file, specify a filename:
draw_graph(triage_agent, filename="agent_graph.png")
This will generate agent_graph.png in the working directory.
Testing the Visualization
The visualization functionality includes test coverage to ensure correctness. Tests are located in tests/test_visualizations.py and verify:
- Node and edge correctness in
get_main_graph(). - Proper agent and tool representation in
get_all_nodes(). - Accurate relationship mapping in
get_all_edges(). - Graph rendering functionality in
draw_graph().
Run tests using:
pytest tests/test_visualizations.py
Conclusion
Agent visualization provides a powerful way to understand, debug, and communicate how agents interact within an application. By leveraging Graphviz, you can generate intuitive visual representations of complex agent structures effortlessly.
For further details on agent functionality, see the Agents documentation.