This pull request enhances the document translation workflow by
switching to the new GPT-4.1 model. The generator script’s prompt now
includes a “workflow” section that guides the model to iterate
self-reviews on its outputs to autonomously achieve the highest quality.
This addition has noticeably improved the naturalness and consistency of
the wording in the translated outputs.
2.9 KiB
2.9 KiB
エージェントの可視化
エージェントの可視化では、 Graphviz を使用してエージェントとその関係性を構造的にグラフィカルに表現できます。これは、アプリケーション内でエージェント、ツール、ハンドオフがどのように相互作用しているかを理解するのに役立ちます。
インストール
オプションの viz 依存グループをインストールします:
pip install "openai-agents[viz]"
グラフの生成
draw_graph 関数を使ってエージェントの可視化を生成できます。この関数は、以下のような有向グラフを作成します:
- エージェント は黄色のボックスで表されます。
- ツール は緑色の楕円で表されます。
- ハンドオフ は、あるエージェントから別のエージェントへの有向エッジで表されます。
使用例
from agents import Agent, function_tool
from agents.extensions.visualization import draw_graph

@function_tool
def get_weather(city: str) -> str:
    return f"The weather in {city} is sunny."

spanish_agent = Agent(
    name="Spanish agent",
    instructions="You only speak Spanish.",
)

english_agent = Agent(
    name="English agent",
    instructions="You only speak English",
)

triage_agent = Agent(
    name="Triage agent",
    instructions="Handoff to the appropriate agent based on the language of the request.",
    handoffs=[spanish_agent, english_agent],
    tools=[get_weather],
)

draw_graph(triage_agent)
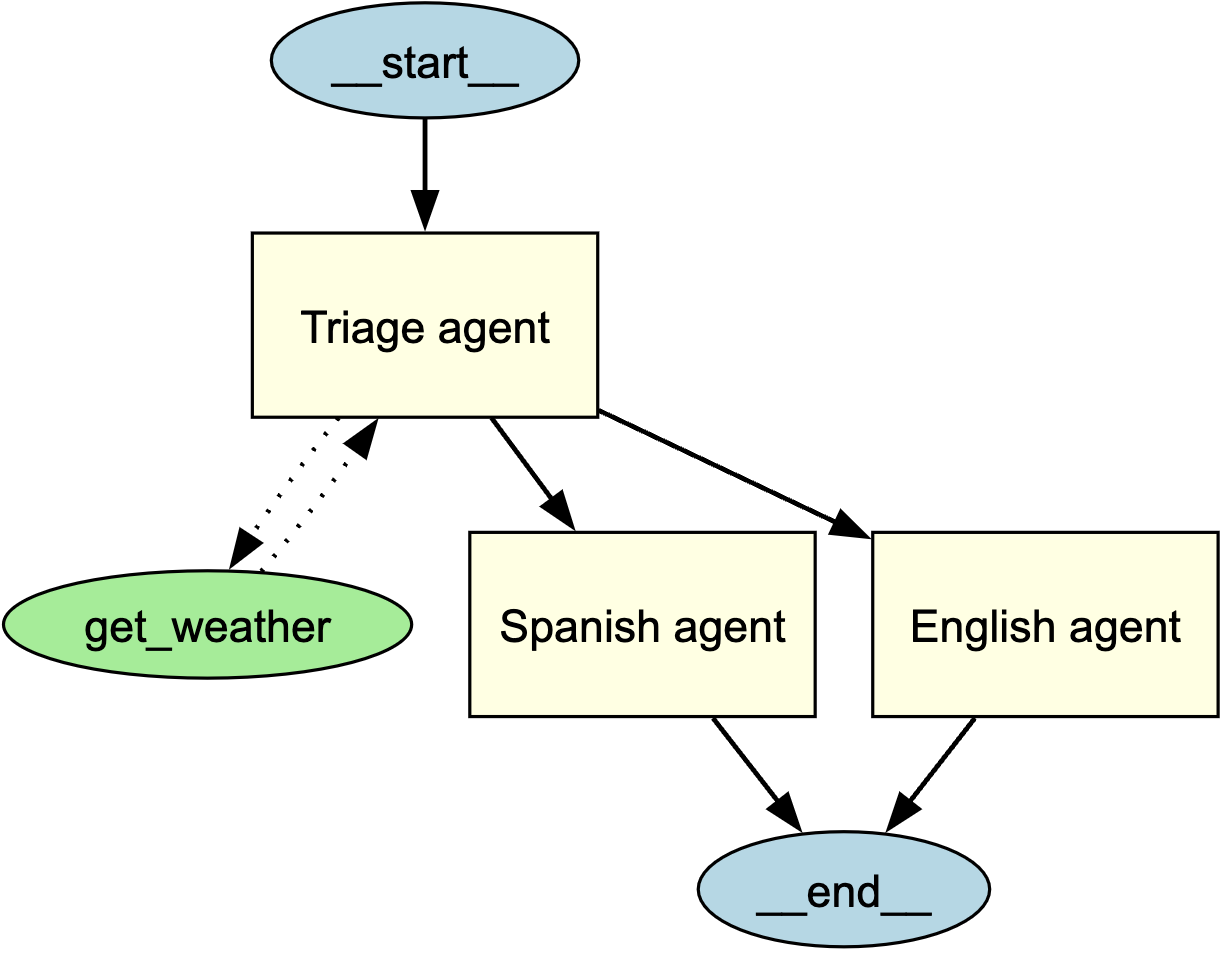
これにより、 triage agent の構造とサブエージェントやツールとの接続が視覚的に表現されたグラフが生成されます。
可視化の理解
生成されたグラフには以下が含まれます:
- エントリーポイントを示す start node (
__start__) - 黄色で塗りつぶされた 長方形 で表されるエージェント
- 緑色で塗りつぶされた 楕円 で表されるツール
- 相互作用を示す有向エッジ:
- エージェント間のハンドオフには 実線の矢印
- ツール呼び出しには 点線の矢印
- 実行が終了する場所を示す end node (
__end__)
グラフのカスタマイズ
グラフの表示
デフォルトでは、draw_graph はグラフをインラインで表示します。グラフを別ウィンドウで表示したい場合は、次のように記述します:
draw_graph(triage_agent).view()
グラフの保存
デフォルトでは、draw_graph はグラフをインラインで表示します。ファイルとして保存したい場合は、ファイル名を指定します:
draw_graph(triage_agent, filename="agent_graph.png")
これにより、作業ディレクトリに agent_graph.png が生成されます。